> ## Documentation Index
> Fetch the complete documentation index at: https://docs.docwriter.org/llms.txt
> Use this file to discover all available pages before exploring further.
# Observability
> Inspect what the agent has been doing — the history pane, the transcript viewer, the message detail.
The agent isn't a black box. Two surfaces let you watch what it's
doing in the moment and inspect what it did earlier.
## The history pane (live)
The right pane of the editor logs every event the agent emits, as it
happens:
* Tool calls (`read_doc`, `edit_doc`, `WebSearch`, `Bash`, ...)
* Hook runs (the shell command, exit code, stdout, stderr, duration)
* Plain assistant text (when the agent speaks rather than acts)
* Comments the agent posts
* Errors
Each event is a card. Cards stream in newest-first. Hovering a tool
call shows the tool's input arguments; clicking expands the card to
show the full result.
The history pane only covers the current turn (the latest agent pass).
For the full session — every turn since the last `--new-session` —
open the transcript viewer.
## When a run fails
When a run fails, you see a red toast in the top right of the window
and an error row in the history pane. You continue to see the toast
until you dismiss it, even when the history pane is collapsed.
If your login is no longer valid, you see an authentication label and
instructions for signing in again. For Claude, run `claude` in a terminal
and use `/login`. The agent may retry for a couple of minutes before
reporting the problem, so you may wait without seeing an error. If the
agent still fails after you sign in again, start a new session from the
agent dock.
## The transcript viewer
At the top of the history pane is a **Transcript** button. Clicking it
opens a full-screen viewer over the editor.
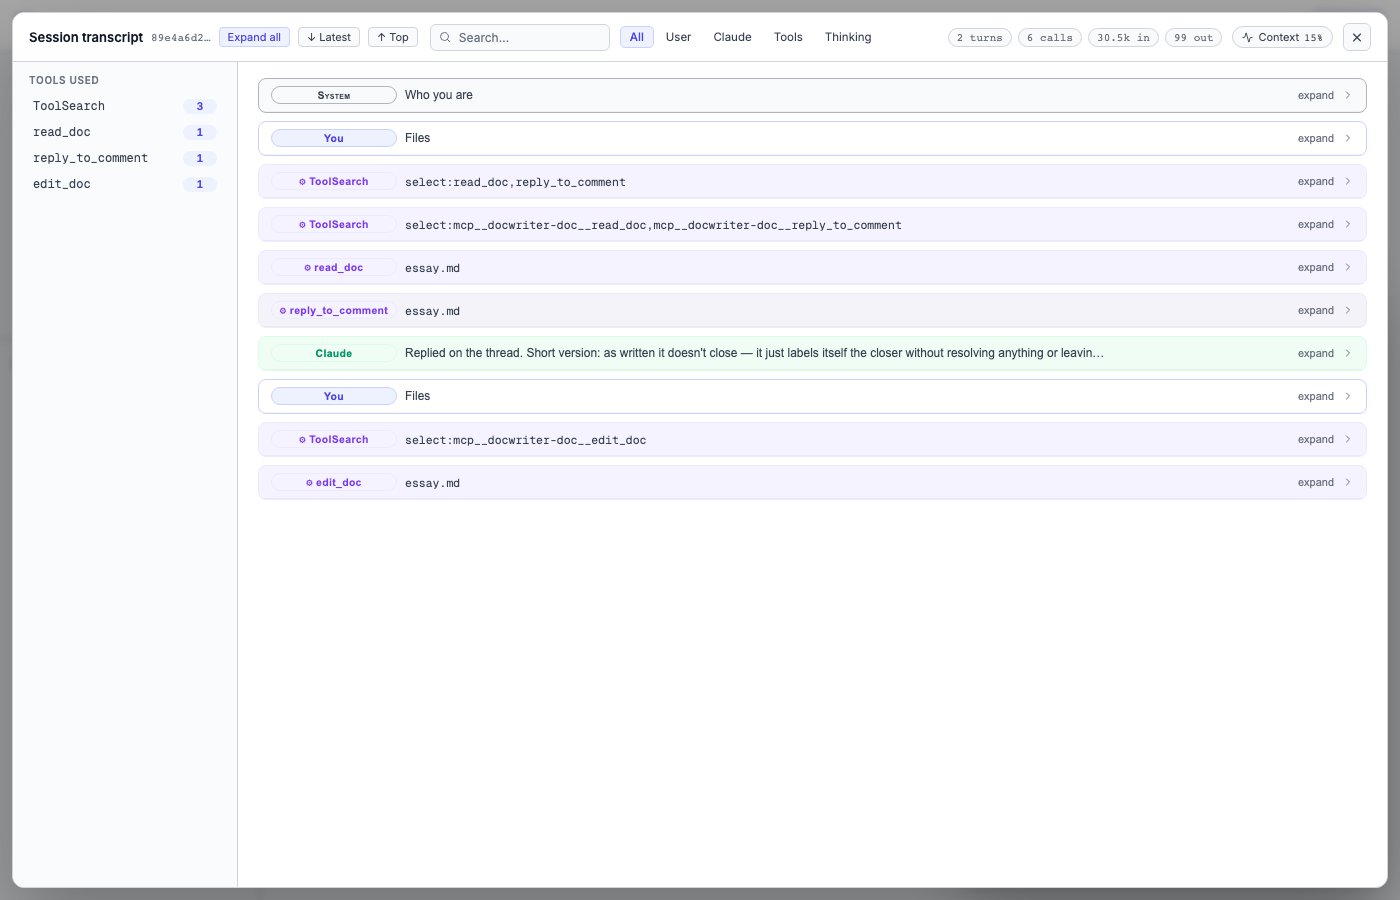 The viewer is read-only and backed by the SQLite session table
directly. It survives reloads, server restarts, and `--new-session`
clears (the prior session sits there as a snapshot until the next
session writes over it).
What's shown, in chronological order:
* **User events.** Every prompt you sent, every wake-up, every action
the UI took on your behalf (accept, reject, retry-with-feedback).
* **Assistant text.** Prose the agent emitted alongside its tool
calls.
* **Tool calls.** Each call gets its own row with the tool name,
collapsed input JSON, and an expandable output panel.
* **Hook runs.** Same format as in the history pane, but the full
stdout/stderr is available.
## Navigating
Three controls at the top:
* **Search.** Free-text search across every event in the session.
Useful for finding "where did the agent fetch that URL" or "what
did I prompt last Tuesday".
* **Filters.** Per-event-type toggles (user messages, assistant text,
tool calls, hook runs, errors). Default shows everything; turn off
whichever categories you don't care about right now.
* **Verbosity.** Toggle between **verbose** (every event) and
**minimal** (just user actions + edits + hook runs + render
boundaries). Useful when you only want to see what *changed*, not
every intermediate Read/Glob/Grep.
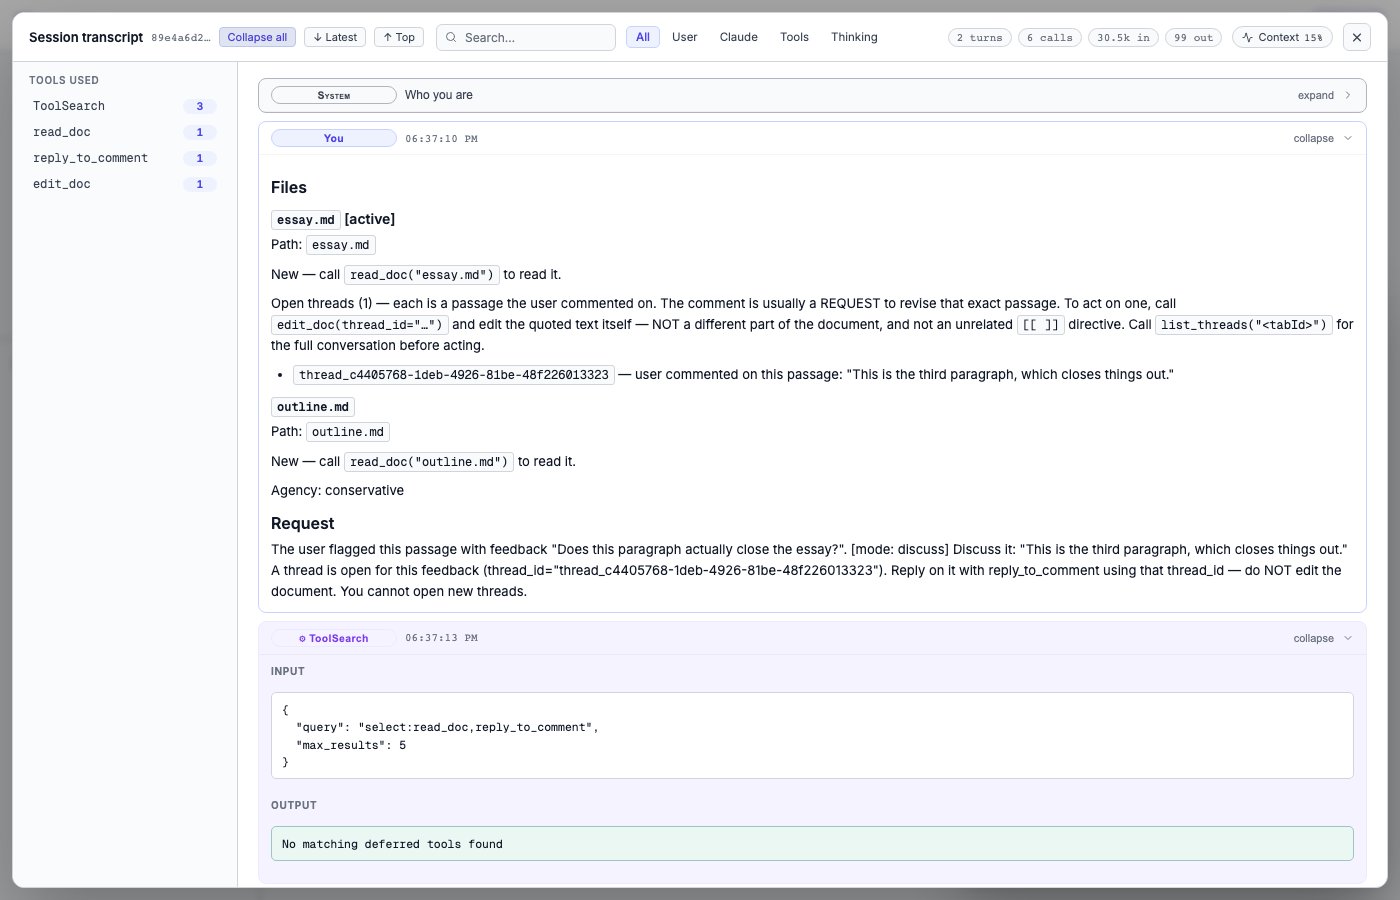
Clicking a tool-call row's **expand** affordance opens its input
arguments (what the agent sent) and the output (what the tool
returned). For file operations this is the file content; for
`WebSearch` it's the search results; for `Bash` it's the command
output.
The search bar plus the filter chips combine. Searching for a tool
name and toggling the **Tools** chip narrows the view to just that
tool's calls, with everything else collapsed out:
The viewer is read-only and backed by the SQLite session table
directly. It survives reloads, server restarts, and `--new-session`
clears (the prior session sits there as a snapshot until the next
session writes over it).
What's shown, in chronological order:
* **User events.** Every prompt you sent, every wake-up, every action
the UI took on your behalf (accept, reject, retry-with-feedback).
* **Assistant text.** Prose the agent emitted alongside its tool
calls.
* **Tool calls.** Each call gets its own row with the tool name,
collapsed input JSON, and an expandable output panel.
* **Hook runs.** Same format as in the history pane, but the full
stdout/stderr is available.
## Navigating
Three controls at the top:
* **Search.** Free-text search across every event in the session.
Useful for finding "where did the agent fetch that URL" or "what
did I prompt last Tuesday".
* **Filters.** Per-event-type toggles (user messages, assistant text,
tool calls, hook runs, errors). Default shows everything; turn off
whichever categories you don't care about right now.
* **Verbosity.** Toggle between **verbose** (every event) and
**minimal** (just user actions + edits + hook runs + render
boundaries). Useful when you only want to see what *changed*, not
every intermediate Read/Glob/Grep.
Clicking a tool-call row's **expand** affordance opens its input
arguments (what the agent sent) and the output (what the tool
returned). For file operations this is the file content; for
`WebSearch` it's the search results; for `Bash` it's the command
output.
The search bar plus the filter chips combine. Searching for a tool
name and toggling the **Tools** chip narrows the view to just that
tool's calls, with everything else collapsed out:
 Press `Esc` (or click outside the viewer) to close it.
## When to look at the transcript
The transcript is most useful when:
* **An agent edit looks wrong** and you want to see exactly what the
agent saw before deciding to make it.
* **Debugging a hook**: the hook's stdout/stderr in the transcript is
the full output, not the 2KB-truncated version in the history
pane.
* **Reproducing a sequence**: you want to see what you prompted last
time you got a result you liked.
* **Auditing**: confirming the agent did what it said it did
(e.g., checking that the citation it used in a footnote was
actually returned by `WebSearch`, not invented).
The transcript is also the system of record for the session. If
something in the history pane looks wrong, the transcript is the
truth.
Press `Esc` (or click outside the viewer) to close it.
## When to look at the transcript
The transcript is most useful when:
* **An agent edit looks wrong** and you want to see exactly what the
agent saw before deciding to make it.
* **Debugging a hook**: the hook's stdout/stderr in the transcript is
the full output, not the 2KB-truncated version in the history
pane.
* **Reproducing a sequence**: you want to see what you prompted last
time you got a result you liked.
* **Auditing**: confirming the agent did what it said it did
(e.g., checking that the citation it used in a footnote was
actually returned by `WebSearch`, not invented).
The transcript is also the system of record for the session. If
something in the history pane looks wrong, the transcript is the
truth.